Analytics
Analytics shows where your credits went. Every number on the page is in credits, and every credit is counted once, under what it bought: accounts, lead sourcing, enrichment, qualification, outreach or playbook automation. How credits are counted lists what each one covers.
Open it from Analytics in the left menu. The screenshots on this page show example data.
Choose the period
The date picker at the top right sets the period for every tab.
- This cycle and Last cycle follow your credit cycle: the days your monthly credits cover, from the day they renew.
- Last 7 days, Last 30 days and Last 90 days end today.
- Or pick any two days on the calendar.
Days are counted in UTC. Next to the main numbers, the page compares the period with the one before it of the same length, so +23% vs previous cycle means 23 % more credits than the last cycle. Over a long range (more than about two months) the daily chart groups days into weeks.
Overview
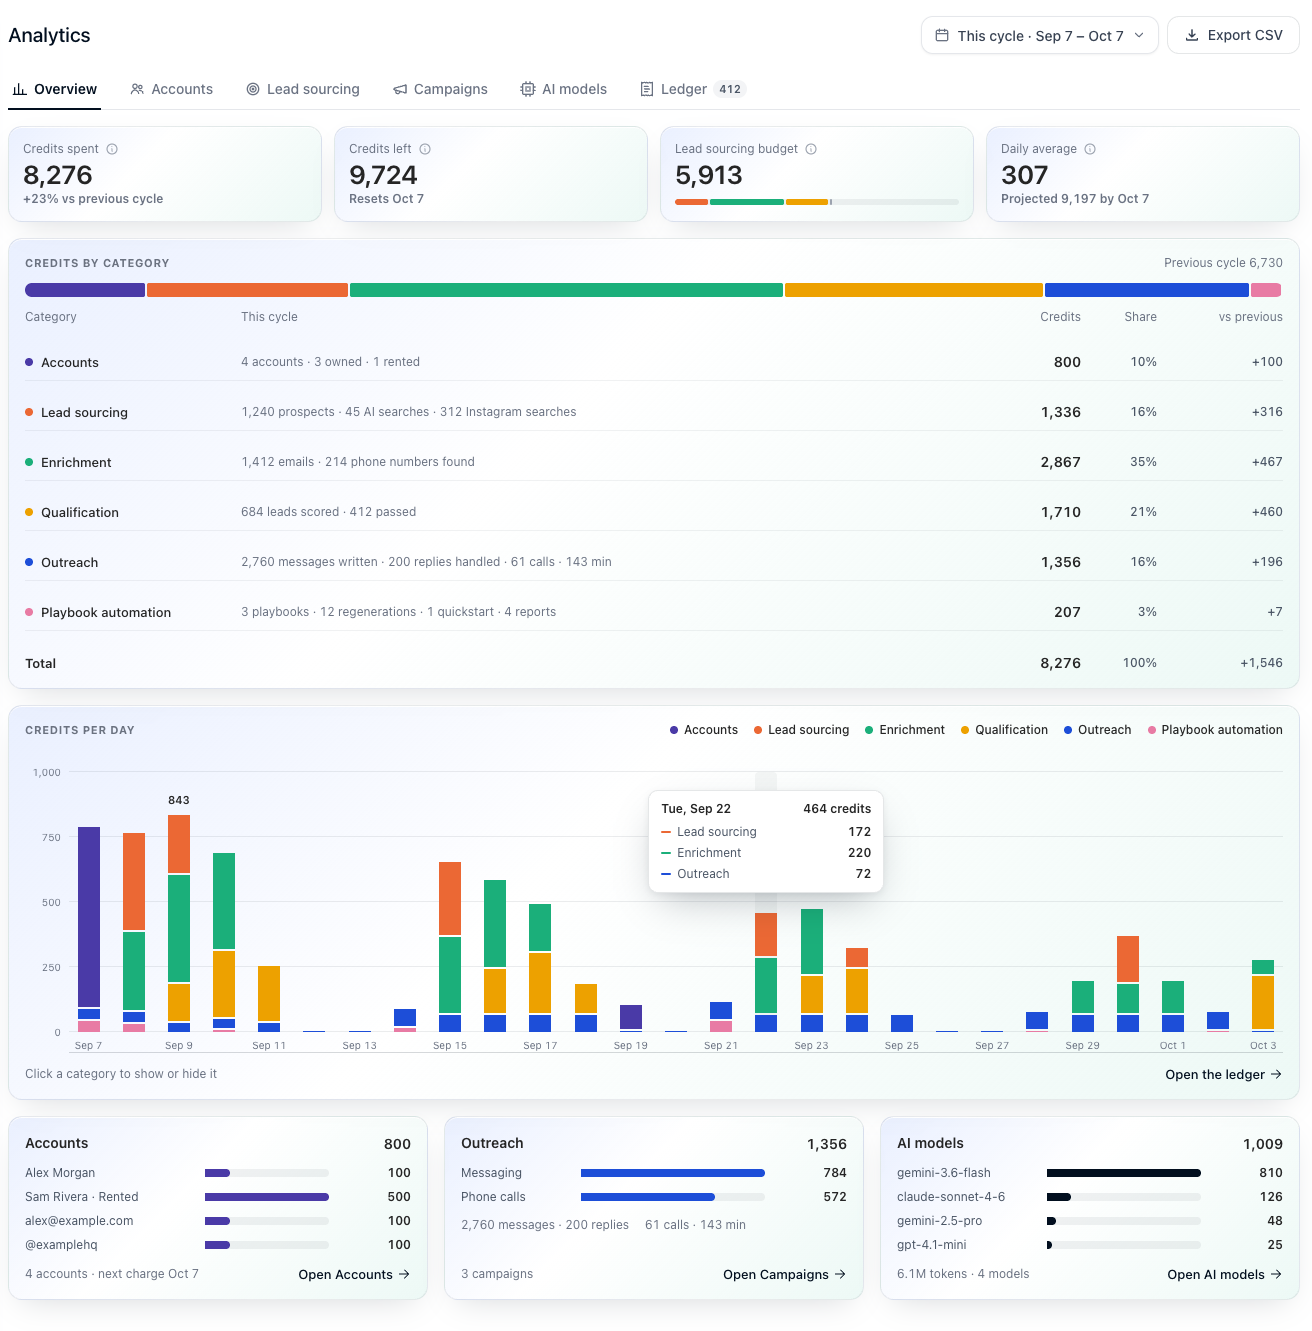
- Credits spent in the period and the change against the previous one. Hover the info icon to see it against your plan's credits plus add-ons.
- Credits left and the day they renew.
- Lead sourcing budget: how much of this cycle's lead sourcing budget is used, as a bar split by category.
- Daily average and where the cycle will end at that pace.
- Credits by category: one bar for the whole period, then a row for each category with what it bought (for example 2,760 messages written · 200 replies handled · 61 calls), its credits, its share and the change against the previous period.
- Credits per day: stacked columns in the same colours. Click a category in the legend to hide it; Show as table gives the same numbers as a table, and hovering or focusing a day lists what it spent. Open the ledger jumps to the list of charges.
- Cards for Accounts, Outreach and AI models show the biggest items of each and open their tab.
When nothing was charged in the period, the page says No charges yet this cycle.
Accounts
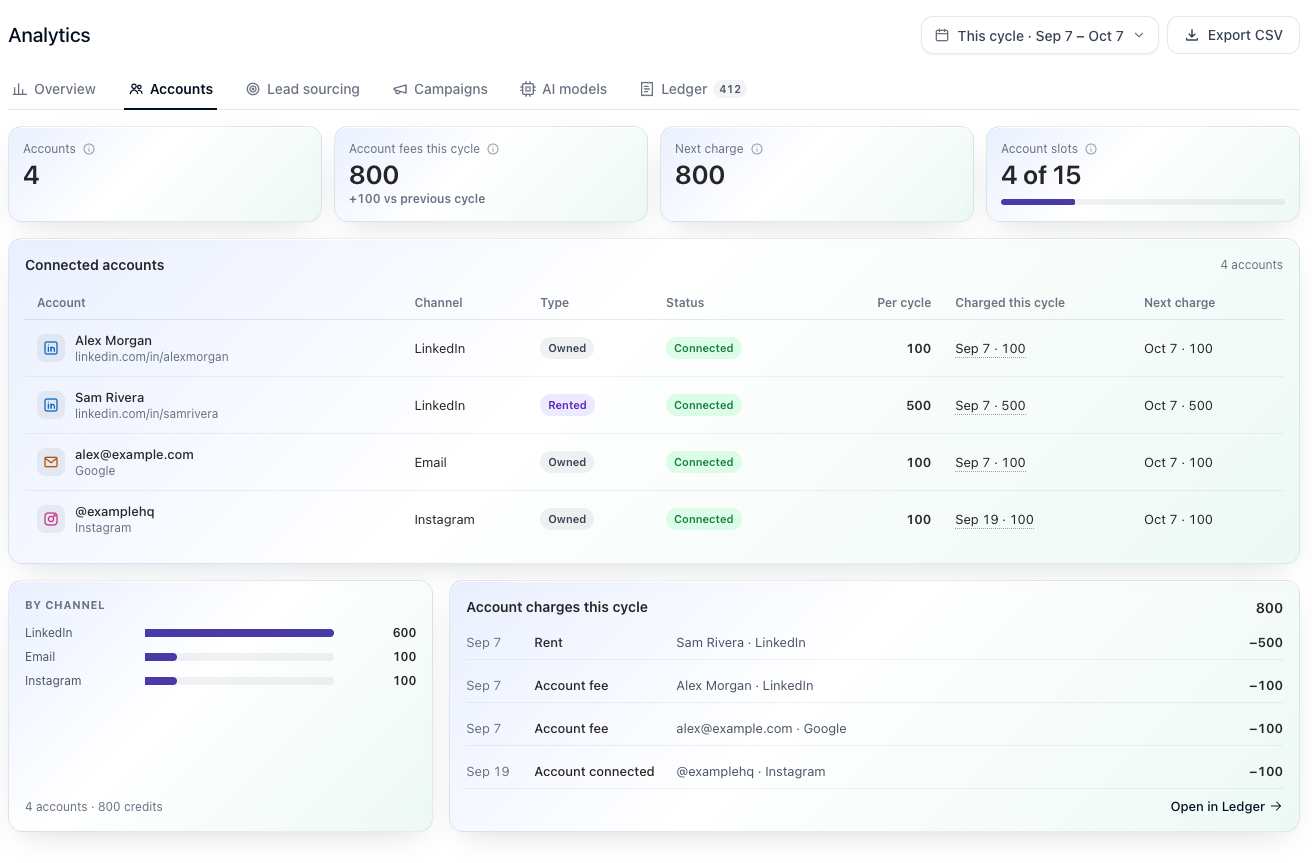
Your connected accounts and what they cost. Account fees this cycle is what was charged so far, Next charge what the next renewal will take, and Account slots how many accounts your plan allows (plans and slots). The table shows each account, whether it is Owned or Rented, what it costs Per cycle, what was charged this cycle and the next charge. A rented account is charged for its rental period; the connector fee you already paid is credited against it.
Lead sourcing
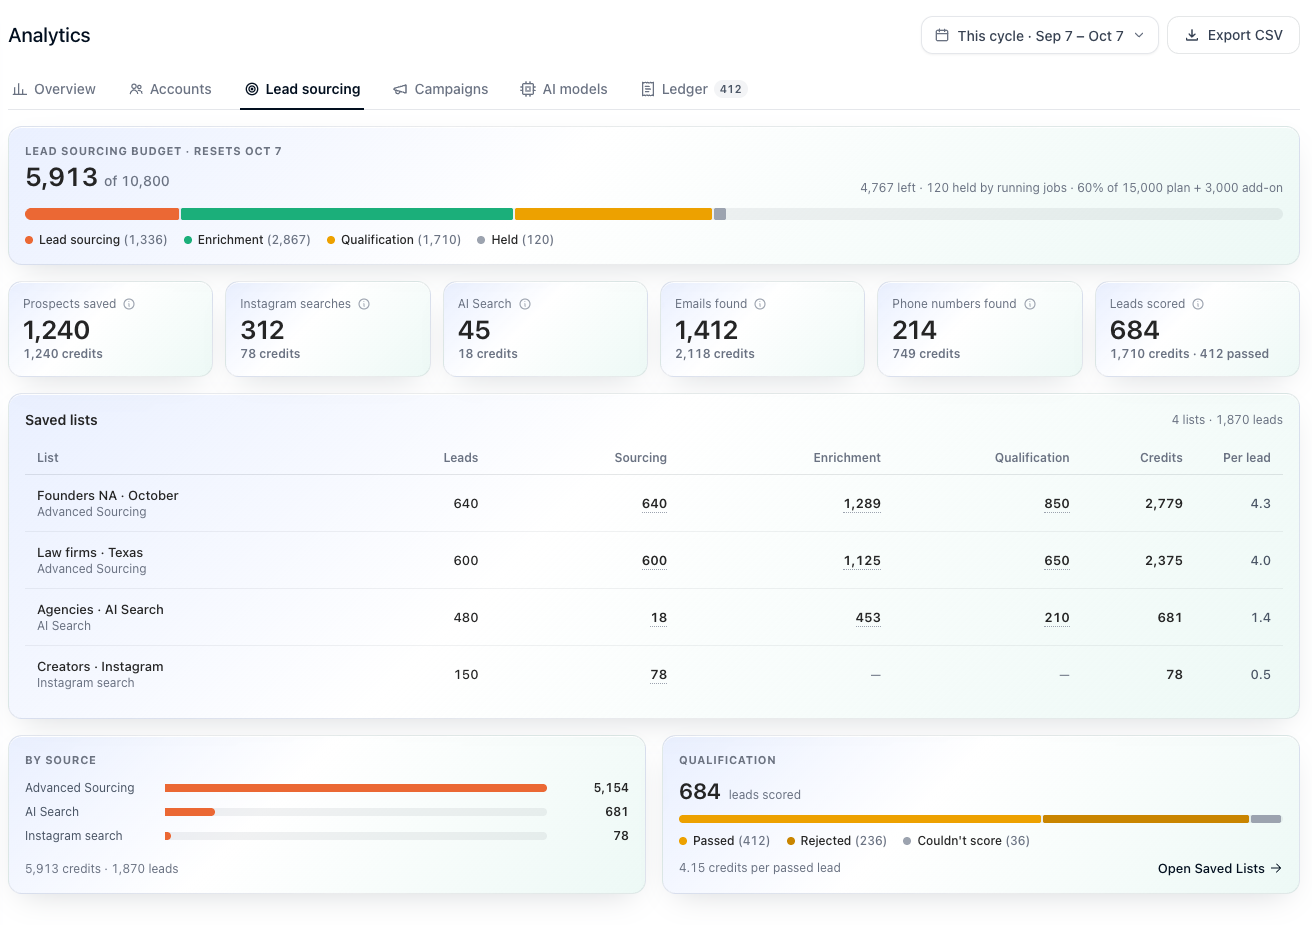
Credits spent finding, enriching and scoring leads, against the cycle's budget (including what is held by work still running). The tiles count what was bought: prospects saved, Instagram searches, AI Search queries, emails found, phone numbers found and leads scored. Saved lists shows the credits each list used, By source splits them by where the leads came from, and Qualification shows how many scored leads passed.
Research and the pre-send budget
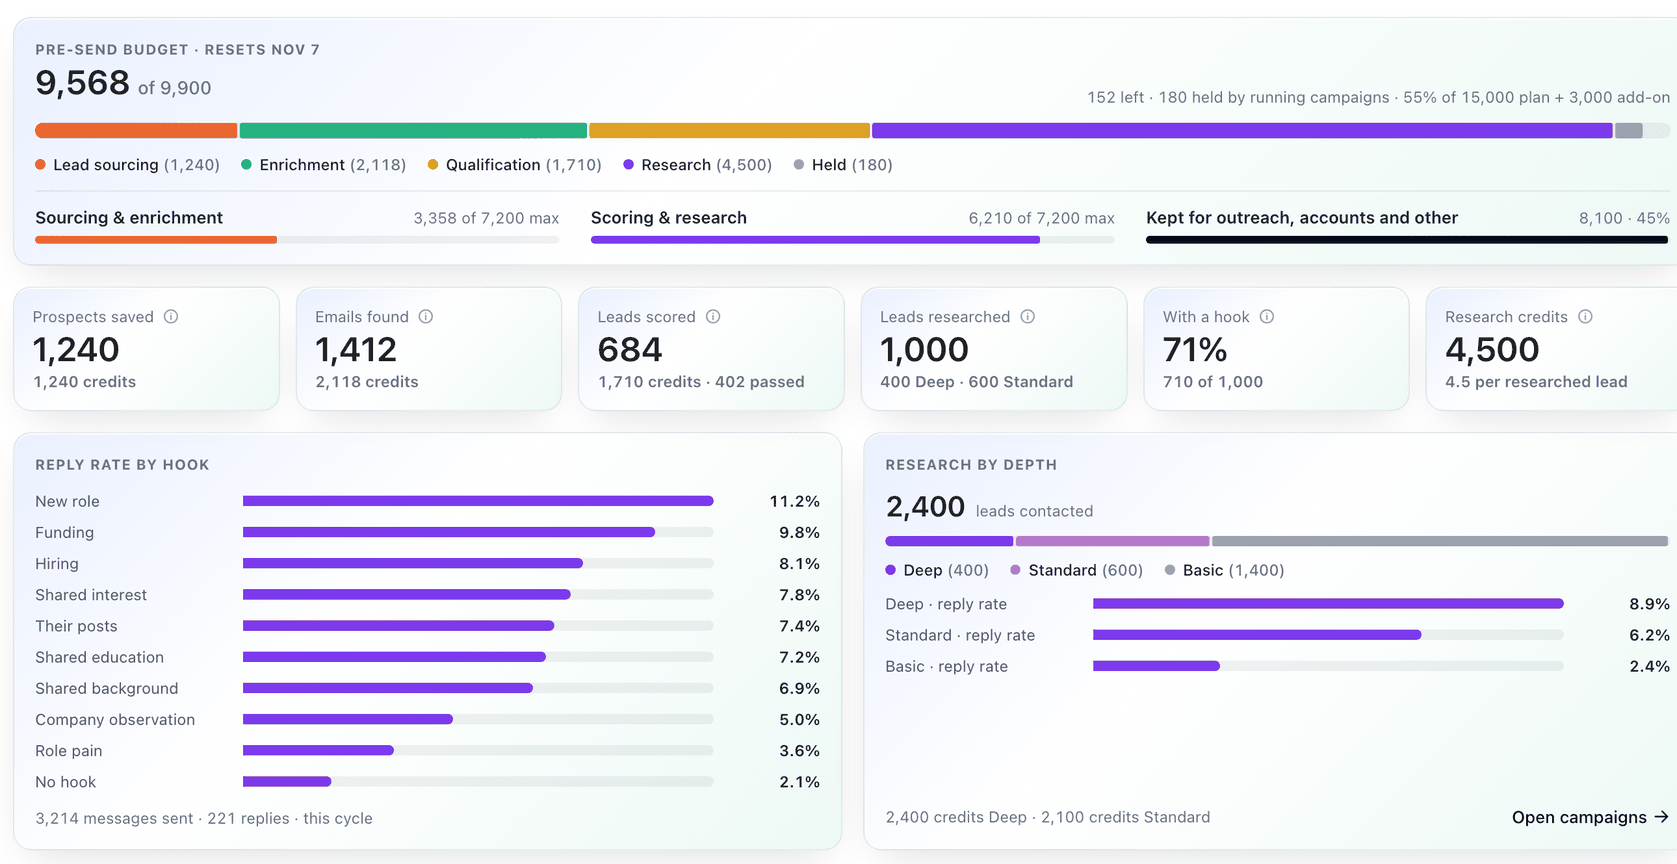
When your campaigns have AI-written steps, the tab also covers research:
| On the tab | What it shows |
|---|---|
| Pre-send budget | The cycle's budget, split by lead sourcing, enrichment, qualification and research, with what is Held by running campaigns. Under the bar, the two buckets, Sourcing & enrichment and Scoring & research, each against its maximum, and the share Kept for outreach, accounts and other. See Lead sourcing budget. |
| Leads researched | How many leads were researched this cycle, split by depth, for example 400 Deep · 600 Standard. |
| With a hook | The share of researched leads that had a hook a message could open on. |
| Research credits | The credits research used, and the average per researched lead. |
| Reply rate by hook | For each hook, the share of messages that got a reply, with No hook for messages that opened on none. Use it to see which kinds of fact work for your audience. It also says how many messages were sent and how many replies came in this cycle. |
| Research by depth | The leads contacted, split into Deep, Standard and Basic, with the reply rate at each depth and the credits each depth used. Use it to judge whether a deeper level pays for itself. Open campaigns takes you to the campaigns behind it. |
The numbers in the picture are examples.
Campaigns
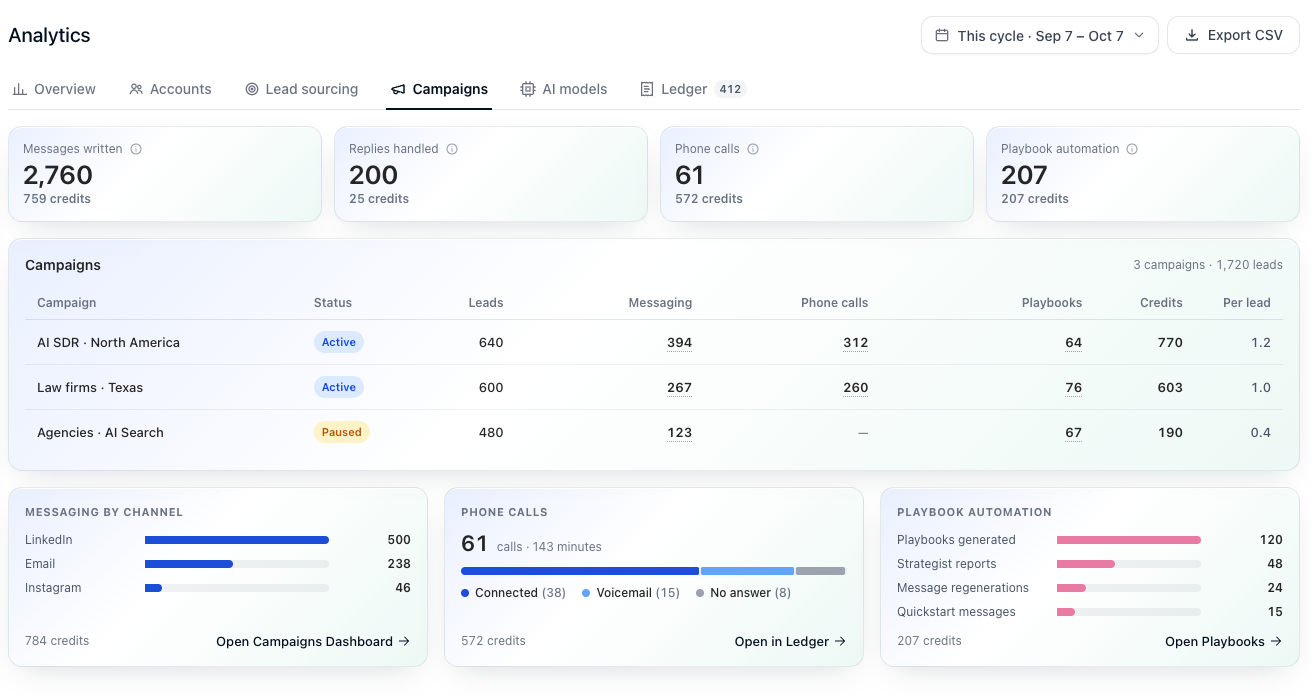
What each campaign spent on messaging, phone calls and playbooks, and what that comes to Per lead. Messaging by channel splits message credits across LinkedIn, email and the other channels. A row named Other holds charges that aren't tied to a campaign.
Sending itself is free: invites, messages sent, visits and emails don't cost credits, so they are not here. They are counted on each campaign's Metrics tab.
AI models
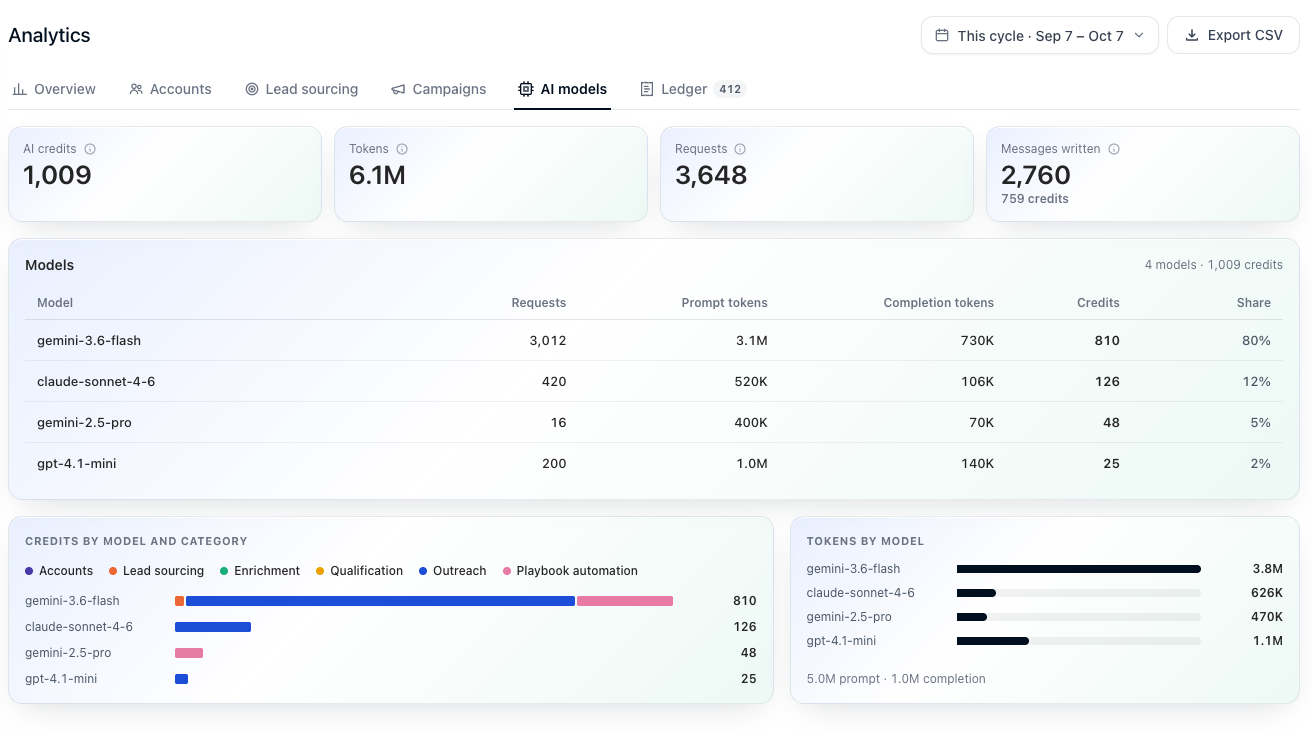
The AI calls behind your credits, by model: requests, prompt and completion tokens, credits and share. Credits by model and category shows which part of the product used each model.
Ledger
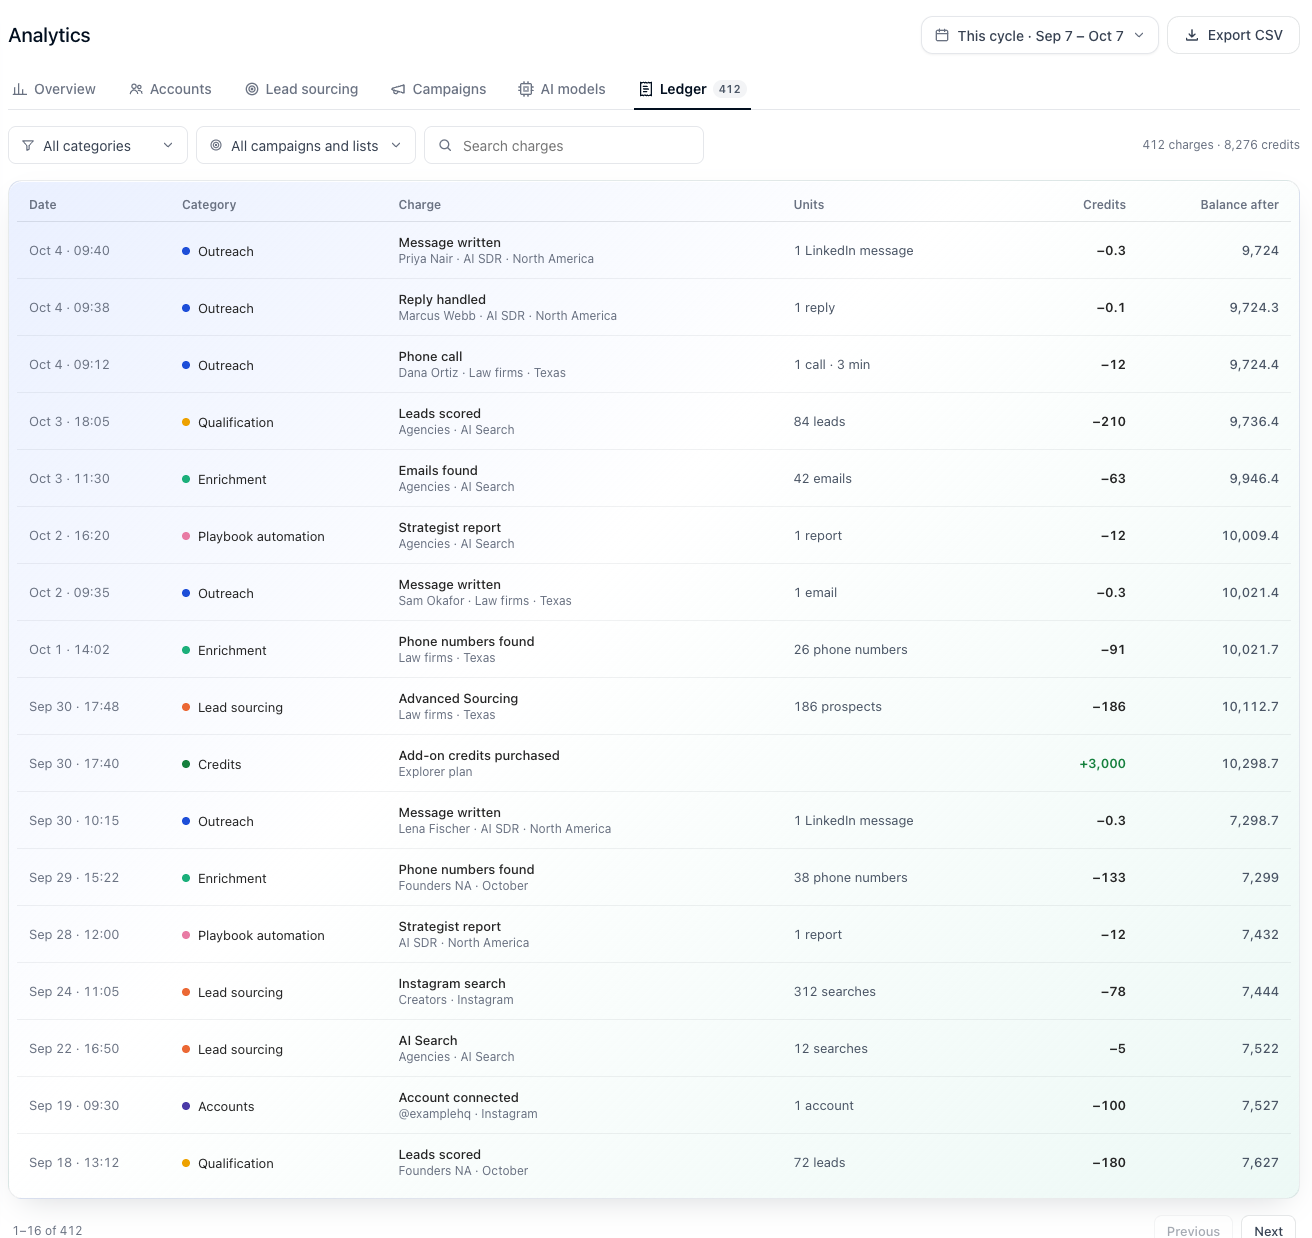
Every movement of credits, newest first: each charge, and the credits that came in (your monthly credits, add-ons you bought, plan changes). A row shows:
- Date, in UTC.
- Category and Charge: what it was, and for outreach and lead work the lead and the campaign or list it was for.
- Units: what the credits bought (1 LinkedIn message, 84 leads, 186 prospects).
- Credits, with credits spent as negative numbers and credits in as positive ones.
- Balance after: your credits left once the row was applied.
Filter by category or by campaign or list, or type a word to find rows by their category, AI model or channel. Messaging is one row per lead, which is why a message can cost a fraction of a credit.
A charge your balance couldn't cover carries an unpaid note on the row, with the part that was left unpaid. The ledger keeps 24 months.
Export CSV
Export CSV at the top right downloads the ledger for the period you picked. On the Ledger tab
it follows the filters too. A range longer than 3 months can't be exported; the button is
disabled and says so. Choose a shorter range. When the file is ready, a message gives its name
(for example credits-2026-09-07-to-2026-10-07.csv) and how many rows it has, with a Download
button.